Figure 1. Hubble Space Telescope ACS optical image of the galaxy NGC 2903, showing regions of star formation in the nuclear region and throughout the spiral arms. Based on data obtained by Luis C. Ho.
Using a large sample of galaxies from the Sloan Digital Sky Survey (SDSS), Ming-Yang Zhuang and Luis C. Ho from the Kavli Institute for Astronomy and Astrophysics at Peking University proposed an updated star formation rate (SFR) calibration using the [O II]λ3727 emission line for star-forming galaxies. Based on photoionization models, they extended the [O II]-based SFR estimator to active galaxies. This work has been published in The Astrophysical Journal (Zhuang & Ho 2019, ApJ, 882, 89).
The SFR is one of the most fundamental physical parameters to understand the formation and evolution of galaxies. Beyond z≈0.5, the most commonly used SFR indicator Hα will be shifted outside optical window. Alternatively, [O II]λ3727 will be available unto z≈1.7.
Ever since the recognition that black hole mass correlates tightly with galaxy properties, much attention has been devoted to the manner in which supermassive black holes might coevolve with their host galaxies. However, due to tremendous energy output from active galactic nuclei (AGNs) to their host galaxies, the entire spectral energy distribution (SED) is affected by AGNs, contaminating traditional SFR estimators.
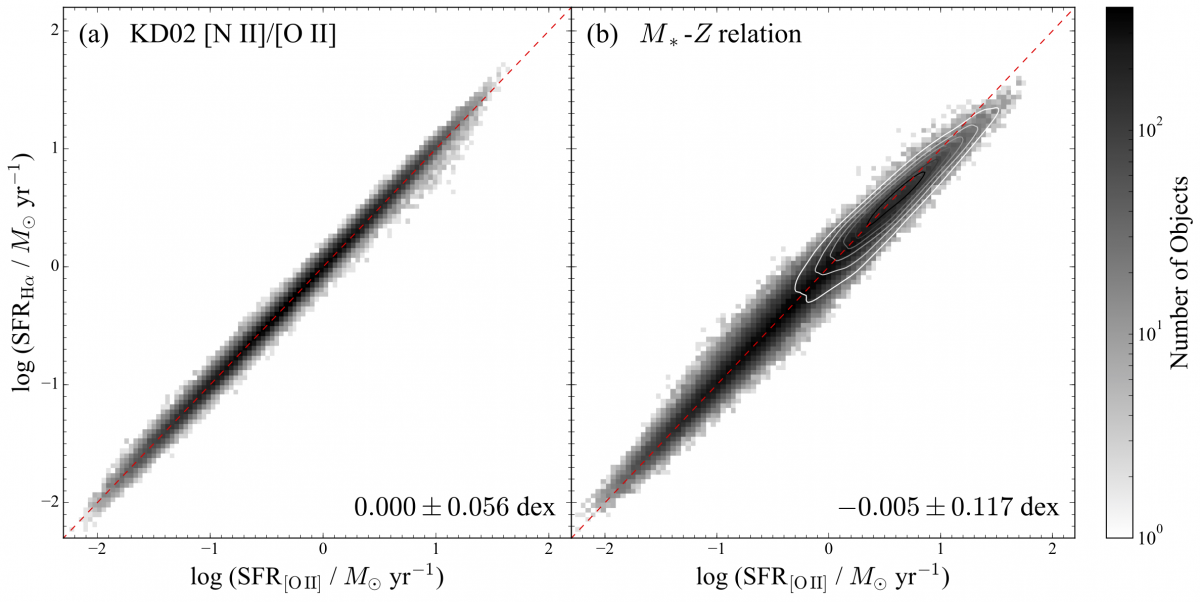
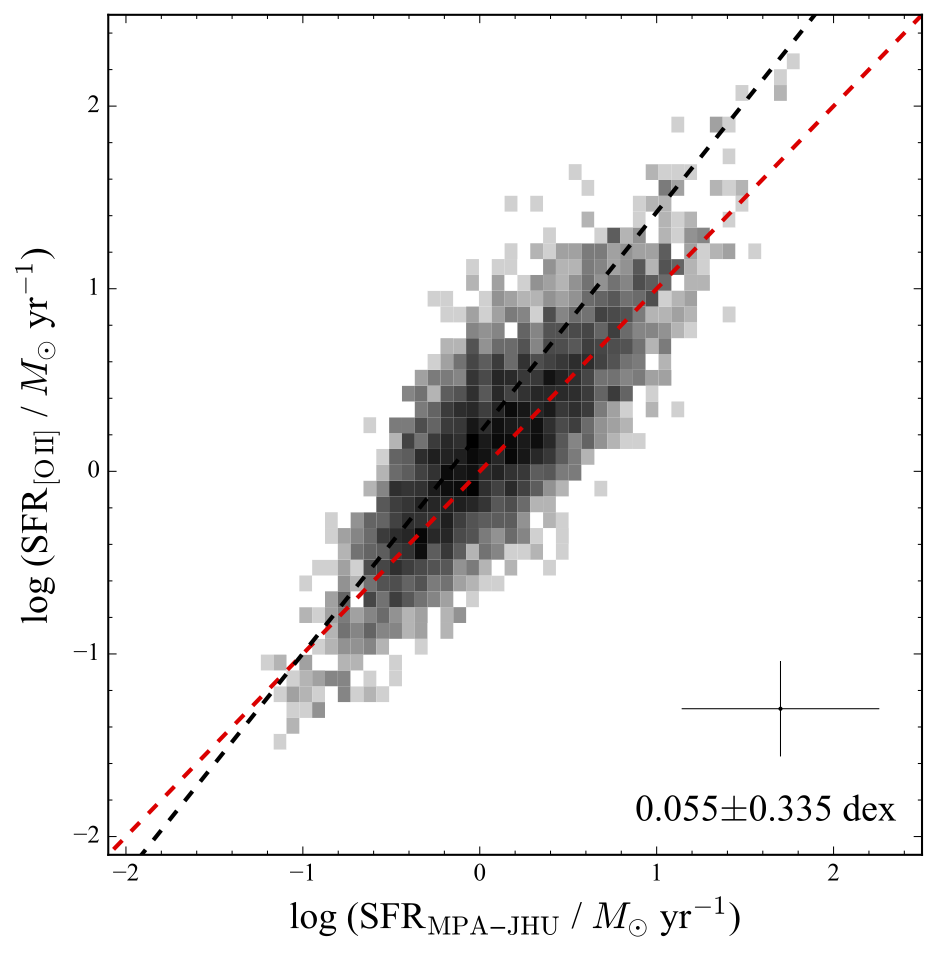
Using nearly 100,000 star-forming galaxies from SDSS DR7, Zhuang and Ho presented a recalibration of [O II] SFR estimator, achieving excellent global consistence with 0.056 dex scatter. For AGNs, they computed a suite of new narrow-line region (NLR) models spanning a large range of physical conditions. They constrained the AGN contribution to [O II] emission using [O III]λ5007 emission. For a sample of ~5,500 narrow-line AGNs, they found a good consistency with an independent SFR diagnostic. The success of the [O II] method provides an effective and robust way to estimate the SFRs in AGN host galaxies, and hence opens a new pathway for investigating the coevolution between AGNs and their host galaxies.

Figure 2. Comparison of SFRs from Hα to those from [O II] with oxygen abundance correction from (a) the [N II]/[O II] method and (b) the M_*–Z relation using [N II]/[O II] method from Kewley & Ellison (2008). The median and standard deviation of the difference in SFRs, log SFR(Hα)−log SFR([O II]), are shown in the bottom-right corner of each panel. Contours in panel (b) indicate the distribution of objects with M_* > 10^10.5 M_sun. Red dashed line denotes 1:1 relation.

Figure 3. Comparison of SFRs derived from [O II] with those from the MPA-JHU catalog for AGNs, with AGN contribution subtracted. The MPA-JHU SFRs are based on the relation between sSFR and D4000 in star-forming galaxies (Brinchmann et al. 2004). The median and standard deviation of the difference, as well as typical errors for both SFRs, are shown on the bottom-right corner of the panel. Red and black dashed lines denote the 1:1 relation and the least-squares fit to the data, respectively.